One operational view
Bring treatment, chemical, well activity, live values, and field context into one dashboard for the people making decisions.
 Jason BeckmannVisit Frac Plotter
 Case study 01
Beckmann Frac Plotter
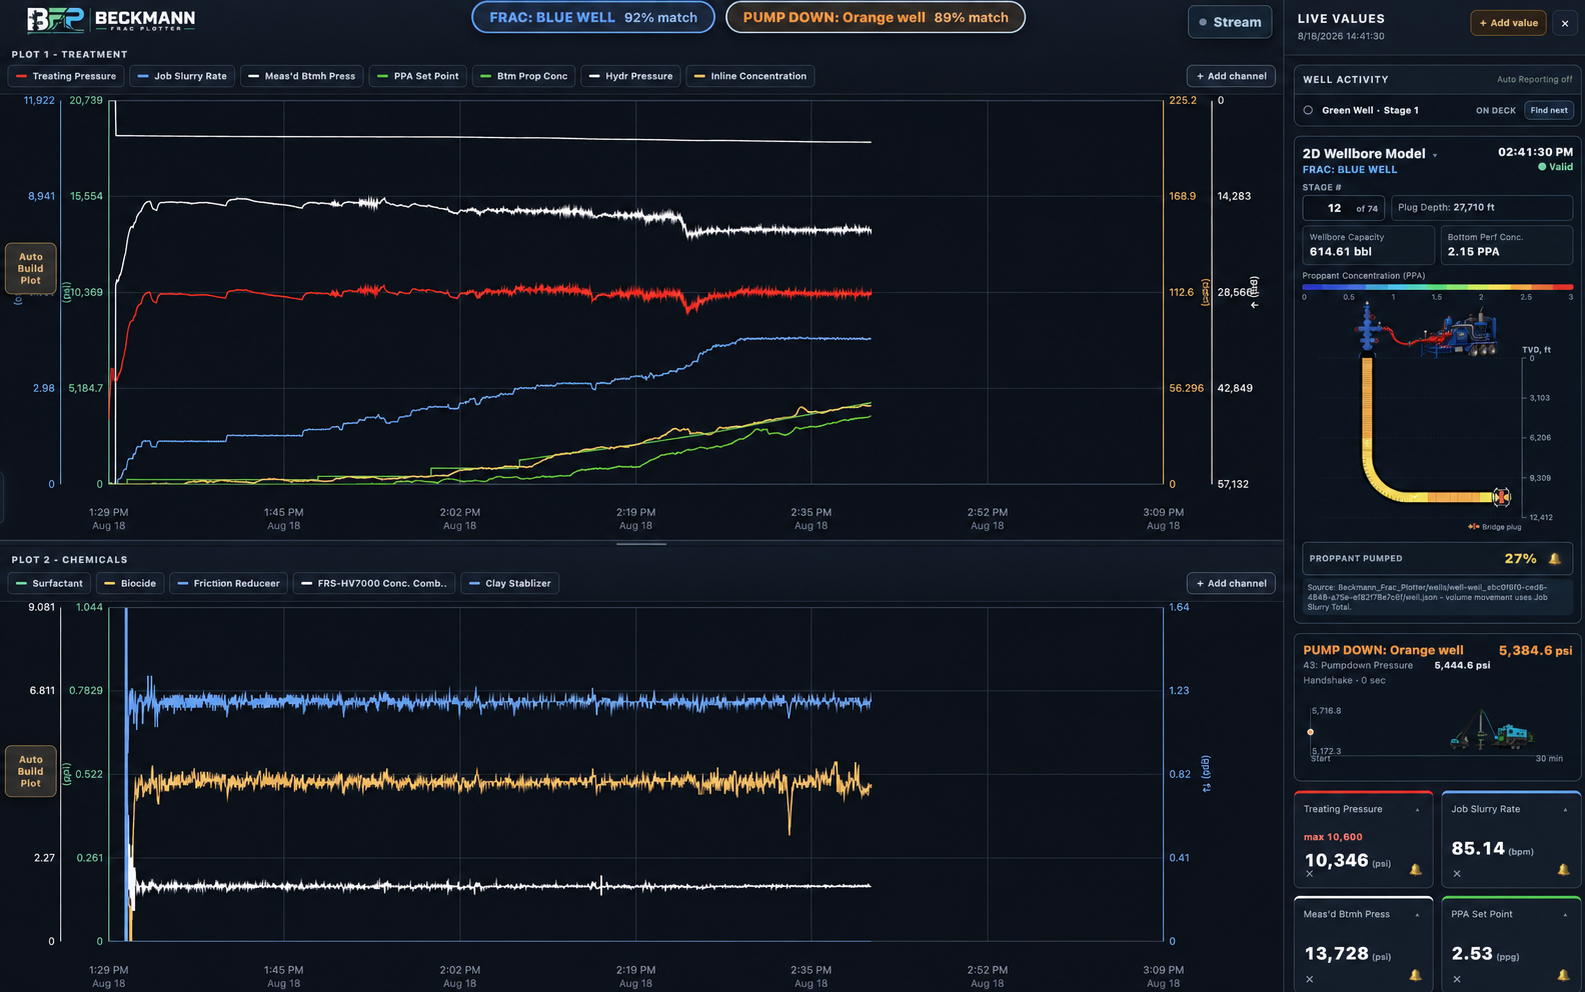
A centralized application that brings the pertinent live operational data available at a frac location into one dashboard for treaters, engineers, and customer teams.
The operating problem
Inside the data van, data can be split across treatment files, chemical records, well plans, and the people watching the job. Off-location engineers often need the same context quickly, while reports and chemical totals still need to stand up to review later.
The design focus is not simply a better plot. It is a single operating view that reduces time spent finding, reconciling, and explaining the information that already exists.
 Application visual · Wellbore context
From data to context
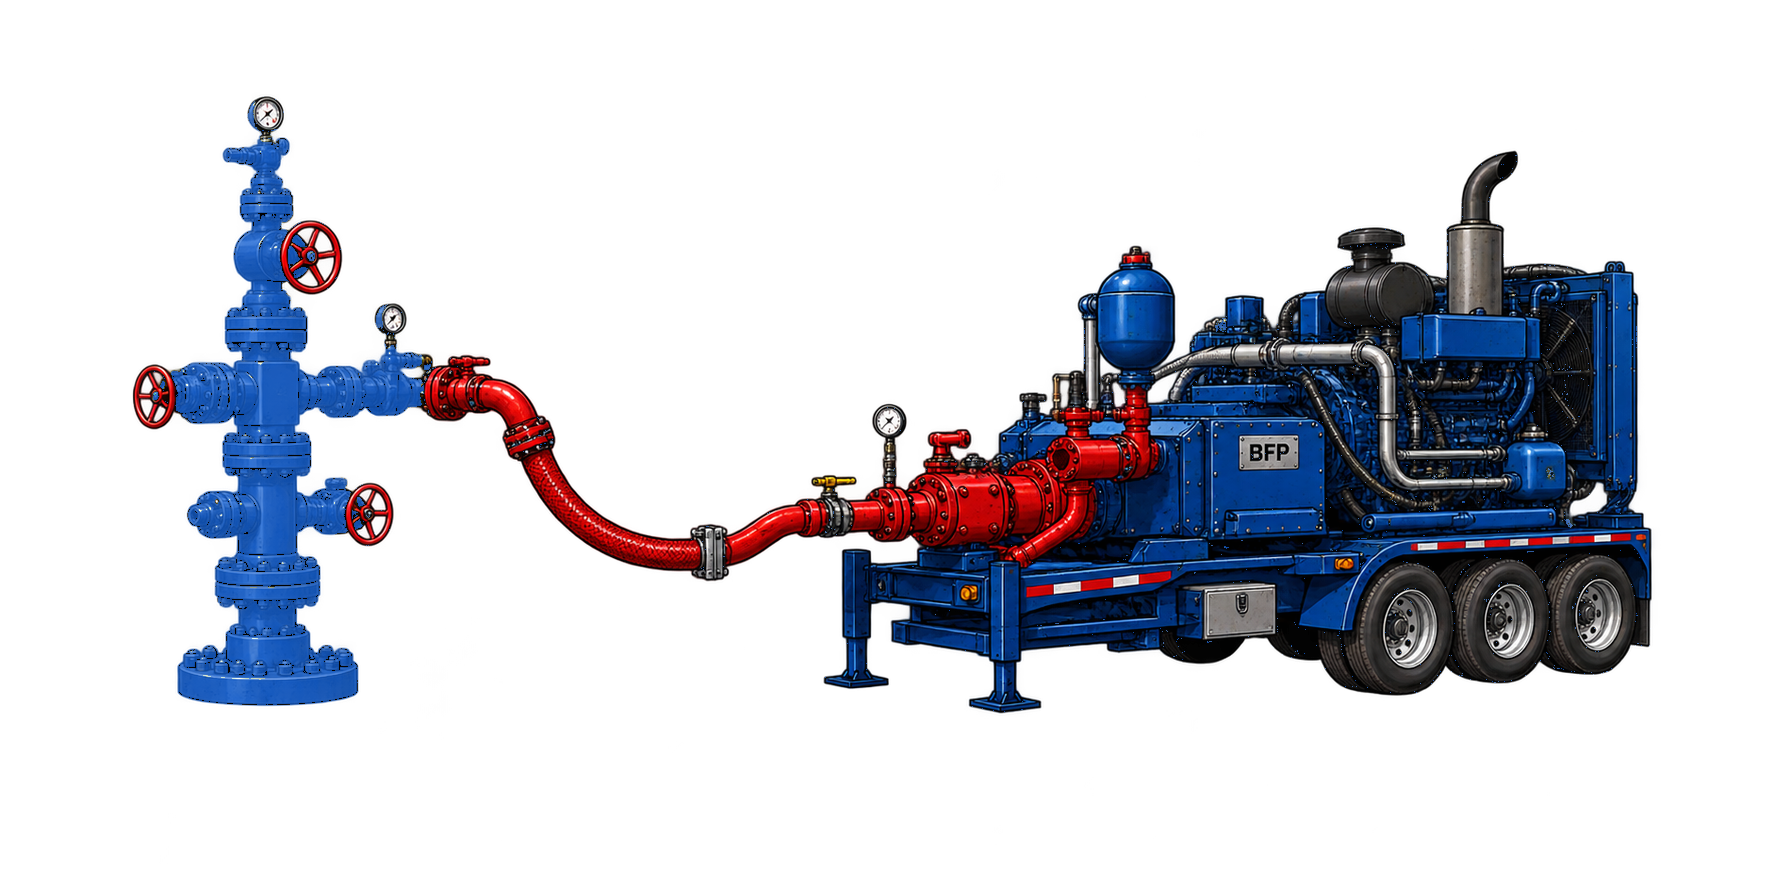
The application combines operational channels with stage and volume context, helping an engineer read the treatment alongside the modeled wellbore rather than in isolation.
The five pillars
Bring treatment, chemical, well activity, live values, and field context into one dashboard for the people making decisions.
Use matching logic to connect the active pumping or perforating context to the right well and stage, with an operator able to confirm or edit the match.
Turn fast-changing pressure, rate, concentration, and wellbore-volume data into clear plots, alarm context, and visuals that support timely calls.
Make a private, read-only treatment view available to authorized off-location engineers so they can assess the operation without waiting for a handoff.
Keep chemical usage, inventory, and operational reporting connected so calculations can be checked in one place instead of reconciled after the job.
The supporting foundation
The command-center experience only works if the data path, access model, and release process are dependable enough for operational use.
Retain the last known-good view, retry temporary file-read failures, and avoid treating a partial record as a completed operational update.
Process operational CSV content locally by default; share a private, read-only rendered treatment stream only when remote visibility is needed.
Exercise the file reading, stage context, reporting, inventory, and layout behaviors that make the dashboard trustworthy in practice.
Screening interview summary
“I approached Frac Plotter as a centralized command center for the frac location. The goal was to put live treatment, chemical, wellbore, and reporting context into one view for the data van and authorized remote engineers. I also focused on the operational details behind that view: trustworthy reads from changing field files, well matching that an operator can verify, and chemical reporting that can be checked in the same system.”